Financial Performance
Strong performance in Hong Kong and Mainland China, more than offset by operational challenges from our generation portfolio in Australia, resulting in Group operating earnings (before fair value loss of HK$2,937 million on energy forward contracts in Australia) reduced by HK$2,291 million to HK$7,560 million. Total earnings decreased to HK$924 million after considering this unrealised fair value loss and items affecting comparability. Dividend is maintained at the same level as in 2021.
Revenue
Total Earnings
Operating Earnings* (Before Unallocated Expenses)
by Asset Type
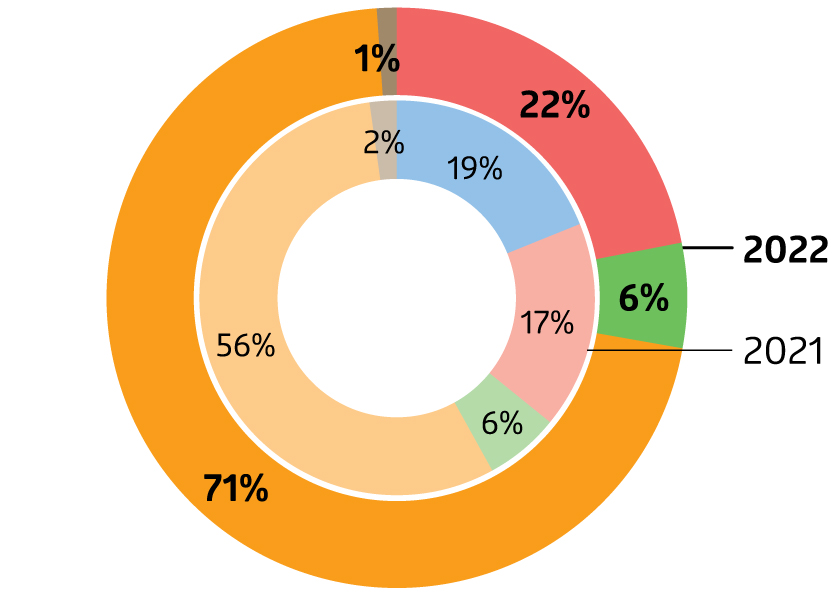
Coal and gas
Nuclear
Renewables
Transmission, distribution and retail
Others
*Excluding fair value movements of energy forward contracts from EnergyAustralia
Capital Investments
Dividend per Share & Dividend Paid
Net Debt & Net Debt / Total Capital (%)
Two-year Summary
For the year (in HK$ million)
Revenue
Hong Kong electricity business
50,600
44,311
14.2
Energy businesses outside Hong Kong
48,873
38,941
25.5
Others
1,189
707
Total
100,662
83,959
19.9
Earnings
Hong Kong energy business 1
8,403
8,141
3.2
Hong Kong energy business related 2
263
301
Mainland China
2,229
1,660
34.3
Australia
(5,267)
(83)
India
193
221
(12.7)
Southeast Asia and Taiwan
11
173
(93.6)
Other earnings in Hong Kong 1
(65)
(18)
Unallocated net finance costs
(6)
(9)
Unallocated Group expenses
(1,138)
(869)
Operating earnings
4,623
9,517
(51.4)
Items affecting comparability
(3,699)
(1,026)
Total earnings
924
8,491
(89.1)
Net cash inflow from operating activities
12,734
17,806
(28.5)
At 31 December (in HK$ million)
Total assets
236,026
239,809
(1.6)
Total borrowings
59,217
58,215
1.7
Shareholders’ funds
105,498
113,034
(6.7)
Per share (in HK$)
Earnings per share
0.37
3.36
(89.1)
Dividend per share
3.10
3.10
-
Shareholders’ funds per share
41.76
44.74
(6.7)
Ratios
Return on equity 3 (%)
0.8
7.5
Net debt to total capital 4 (%)
32.0
28.1
FFO interest cover 5 (times)
7
12
Price / Earnings 6 (times)
154
23
Dividend yield 7 (%)
5.4
3.9
Notes:
- Reflecting our business initiatives in energy and infrastructure solutions in Hong Kong, the 2021 earnings of CLPe have been reclassified from other earnings in Hong Kong to Hong Kong energy business to align with current year presentation
- Hong Kong energy business related includes PSDC and Hong Kong Branch Line supporting SoC business
- Return on equity = Total earnings / Average shareholders’ funds
- Net debt to total capital = Net debt / (Equity + advances from non-controlling interests + net debt); debt = bank loans and other borrowings; net debt = debt – bank balances, cash and other liquid funds
- FFO (Funds from operations) interest cover = Cash inflow from operations / (Interest charges + capitalised interest)
- Price / Earnings = Closing share price on the last trading day of the year / Earnings per share
- Dividend yield = Dividend per share / Closing share price on the last trading day of the year