Financial Performance
Group operating earnings before fair value movements increased 33.2% to HK$10,127 million attributable to dependable contributions from our core business in Hong Kong and Mainland China and significant improvement in overseas business. With the turnaround of fair value movements, from a loss of HK$2,979 million to a gain of HK$2,125 million, and after taking into account the items affecting comparability, mainly impairment of goodwill of the Customer business in Australia of HK$5,868 million, total earnings came at HK$6,655 million, a strong rebound from HK$924 million for 2022.
Revenue
Total Earnings
OPERATING EARNINGS BEFORE FAIR VALUE MOVEMENTS BY ASSET TYPE*
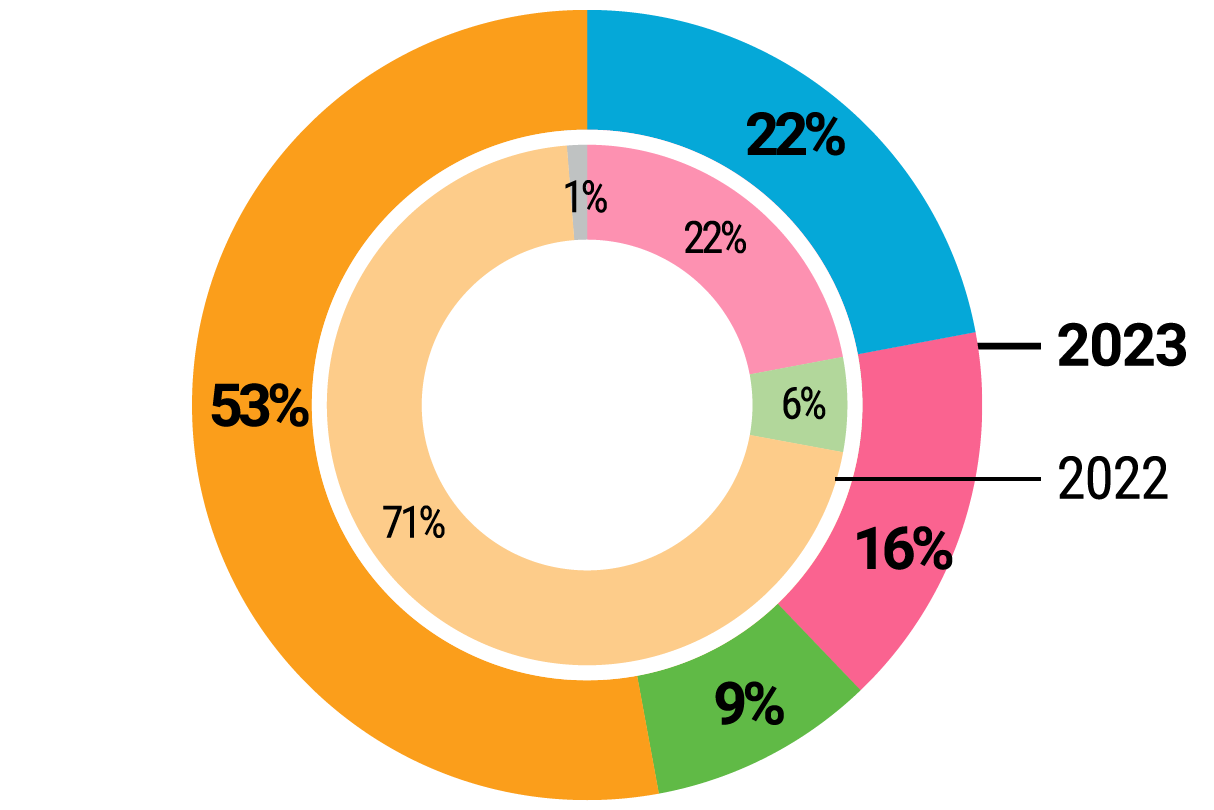
Coal and gas
Nuclear
Renewables
Transmission, distribution and retail
Others
* Before unallocated expenses
Capital Investments
Dividend per Share & Dividend Paid
Net Debt & Net Debt / Total Capital (%)
Two-year Summary
For the year (in HK$ million)
Revenue
Hong Kong electricity business
50,630
50,600
0.1
Energy businesses outside Hong Kong
35,039
48,873
(28.3)
Others
1,500
1,189
Total
87,169
100,662
(13.4)
Earnings
Hong Kong energy business
8,536
8,445
1.1
Hong Kong energy business related1
287
263
Mainland China
2,073
2,229
(7.0)
Australia
(182)
(2,330)
India
301
193
56.0
Taiwan Region and Thailand
307
11
2,690.9
Other earnings in Hong Kong
(106)
(65)
Unallocated net finance income / (costs)
43
(6)
Unallocated Group expenses
(1,132)
(1,138)
Operating earnings before fair value movements
10,127
7,602
33.2
Fair value movements
2,125
(2,979)
Operating earnings
12,252
4,623
165.0
Items affecting comparability
(5,597)
(3,699)
Total earnings
6,655
924
620.2
Net cash inflow from operating activities
23,567
12,734
85.1
At 31 December (in HK$ million)
Total assets
229,051
236,026
(3.0)
Total borrowings
57,515
59,217
(2.9)
Shareholders’ funds
102,331
105,498
(3.0)
Per share (in HK$)
Earnings per share
2.63
0.37
620.2
Dividend per share
3.10
3.10
-
Shareholders’ funds per share
40.50
41.76
(3.0)
Ratios
Return on equity2 (%)
6.4
0.8
Net debt to total capital3 (%)
31.6
32.0
FFO interest cover4 (times)
11
7
Price / Earnings5 (times)
25
154
Dividend yield6 (%)
4.8
5.4
Notes:
- Hong Kong energy business related includes PSDC and Hong Kong Branch Line supporting SoC business
- Return on equity = Total earnings / Average shareholders’ funds
- Net debt to total capital = Net debt / (Equity + advances from non-controlling interests + net debt); debt = bank loans and other borrowings; net debt = debt – bank balances, cash and other liquid funds
- FFO (Funds from operations) interest cover = Cash inflow from operations / (Interest charges + capitalised interest)
- Price / Earnings = Closing share price on the last trading day of the year / Earnings per share
- Dividend yield = Dividend per share / Closing share price on the last trading day of the year